

In many ways, what we’ve seen so far in 2020 has been both record-breaking and devastating. From the S&P 500 Index peak on February 19 to the bear market lows March 23, stocks lost 33.9%. Now, 50 trading days later, stocks have gained 39.6%, for the largest 50-day rally since the S&P 500 moved to 500 stocks in 1957.
“There are no rollercoasters that can replicate what stocks have done so far in 2020,” exclaimed LPL Financial Senior Market Strategist Ryan Detrick. “Here’s the catch though: Big 50-day rallies in the past have taken place near the start of new bull markets, and the returns going out a year were quite bullish.”
As shown in the LPL Chart of the Day, the 39.6% gain in 50 days was the greatest 50-day rally ever, besting the previous best in October 1982. What’s important to note here is that many of these rallies took place coming off major market lows, and delivered quite strong returns going out 6 to 12 months.
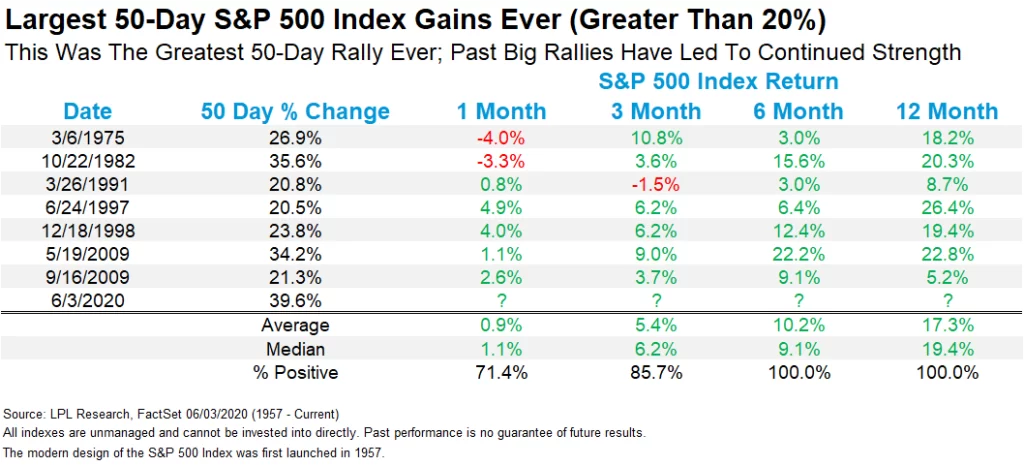
Although we have near-term worries given this historic run, as some sentiment indicators such as put/call ratios are showing some froth, from a bigger picture perspective, this strong 50-day rally offers a reason to think stock prices may be even higher this time next year.
For more of our investment insights, check out our latest LPL Market Signals Podcast.
IMPORTANT DISCLOSURES
This material is for general information only and is not intended to provide specific advice or recommendations for any individual. There is no assurance that the views or strategies discussed are suitable for all investors or will yield positive outcomes. Investing involves risks including possible loss of principal. Any economic forecasts set forth may not develop as predicted and are subject to change.
References to markets, asset classes, and sectors are generally regarding the corresponding market index. Indexes are unmanaged statistical composites and cannot be invested into directly. Index performance is not indicative of the performance of any investment and do not reflect fees, expenses, or sales charges. All performance referenced is historical and is no guarantee of future results.
Any company names noted herein are for educational purposes only and not an indication of trading intent or a solicitation of their products or services. LPL Financial doesn’t provide research on individual equities. All information is believed to be from reliable sources; however, LPL Financial makes no representation as to its completeness or accuracy.
This Research material was prepared by LPL Financial, LLC.
Securities and advisory services offered through LPL Financial (LPL), a registered investment advisor and broker-dealer (member FINRA/SIPC).
Insurance products are offered through LPL or its licensed affiliates. To the extent you are receiving investment advice from a separately registered independent investment advisor that is not an LPL affiliate, please note LPL makes no representation with respect to such entity.
All index and market data is from FactSet and Bloomberg.
- Not Insured by FDIC/NCUA or Any Other Government Agency
- Not Bank/Credit Union Guaranteed
- Not Bank/Credit Union Deposits or Obligations
- May Lose Value
For Public Use – Tracking 1-05018412