The global equity weakness continued yesterday, with consecutive 3% drops for the S&P 500 Index for the first time since August 2015. It might be hard to believe, but exactly one week ago today the S&P 500 was making a new all-time high. What a difference seven days makes!
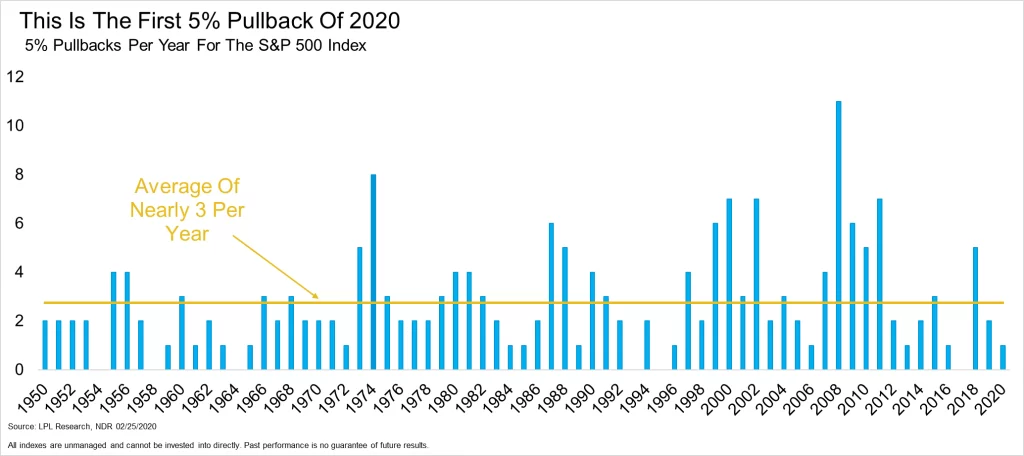
Yes, the uncertainty that that coronavirus outbreak has caused has sparked the weakness we’ve seen over the past week, but at times like these, it is important to remember that markets go both up and down. “The S&P 500 has pulled back more than 5% from the recent peak, which has many investors on edge,” said LPL Financial Senior Market Strategist Ryan Detrick. “Importantly, most years see stocks pull back at least 5% multiple times. Even as good as last year was, stocks still pulled back 5% twice.”
As shown in the LPL Chart of the Day, since 1950, the S&P 500 has seen an average of nearly three separate 5% pullbacks per year. Although a 1995 or 2017 can happen (years which don’t see any 5% pullbacks), it is much more common for there to be multiple 5% pullbacks in any given year.
The recent bout of volatility has sent many investors on edge, but we continue to expect a return to pre-outbreak levels of global economic growth and corporate profits within the next several months, which should help continue to power this record-long bull market and economic expansion through 2020.
For more of our investment insights and thoughts on the coronavirus, check out our latest LPL Market Signals podcast Coronavirus Risk and Global Growth.
IMPORTANT DISCLOSURES
This material is for general information only and is not intended to provide specific advice or recommendations for any individual. There is no assurance that the views or strategies discussed are suitable for all investors or will yield positive outcomes. Investing involves risks including possible loss of principal. Any economic forecasts set forth may not develop as predicted and are subject to change.
References to markets, asset classes, and sectors are generally regarding the corresponding market index. Indexes are unmanaged statistical composites and cannot be invested into directly. Index performance is not indicative of the performance of any investment and do not reflect fees, expenses, or sales charges. All performance referenced is historical and is no guarantee of future results.
Any company names noted herein are for educational purposes only and not an indication of trading intent or a solicitation of their products or services. LPL Financial doesn’t provide research on individual equities. All information is believed to be from reliable sources; however, LPL Financial makes no representation as to its completeness or accuracy.
This Research material was prepared by LPL Financial, LLC.
Securities and advisory services offered through LPL Financial (LPL), a registered investment advisor and broker-dealer (member FINRA/SIPC).
Insurance products are offered through LPL or its licensed affiliates. To the extent you are receiving investment advice from a separately registered independent investment advisor that is not an LPL affiliate, please note LPL makes no representation with respect to such entity.
If your representative is located at a bank or credit union, please note that the bank/credit union is not registered as a broker-dealer or investment advisor. Registered representatives of LPL may also be employees of the bank/credit union.
These products and services are being offered through LPL or its affiliates, which are separate entities from, and not affiliates of, the bank/credit union. Securities and insurance offered through LPL or its affiliates are:
- Not Insured by FDIC/NCUA or Any Other Government Agency
- Not Bank/Credit Union Guaranteed
- Not Bank/Credit Union Deposits or Obligations
- May Lose Value
For Public Use – Tracking 1-956244