

Negative yielding debt has been one of the most extraordinary and peculiar consequences of global monetary policy initiatives, turning the basic premise of fixed income investing upside down. Instead of one party lending another party money, and the lender receiving interest in return for the risk incurred, since 2018 the levels of outstanding debt in which the lender pays the borrower for the privilege of loaning the borrower money has skyrocketed. This has left both lenders and fixed income investors in the unfortunate situation of attempting to “lose less” rather than “earn slightly more” than the value of the loan extended.
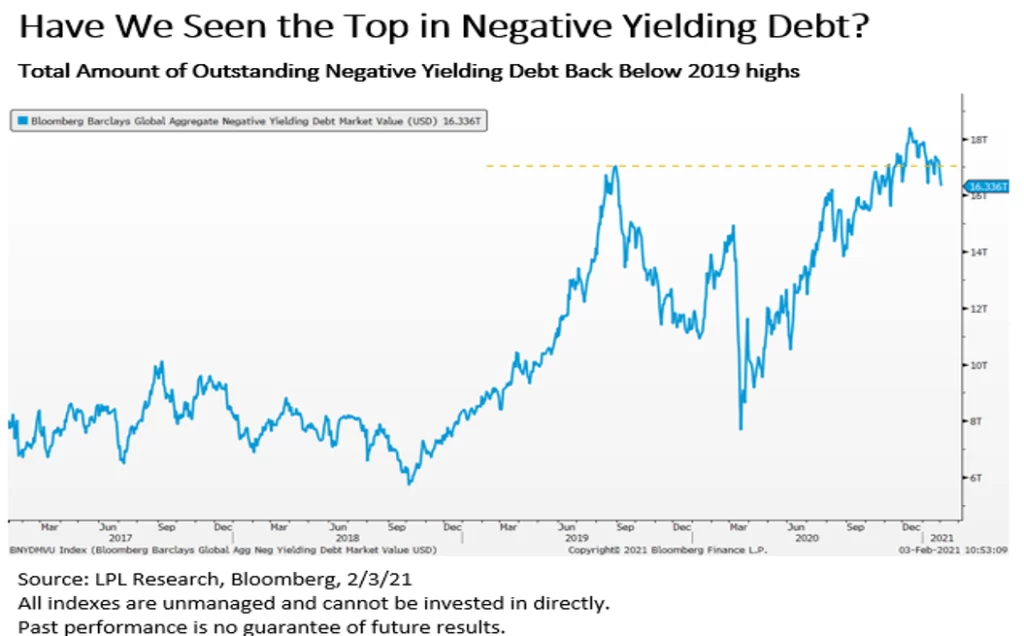
The total value of negative yielding debt around the globe set a new record in the final month of 2020, eclipsing more than $18 trillion as governments around the world issued debt to combat the COVID-19 pandemic. The majority of these bonds are issued by governments in the developed world such as Japan and Europe, while US Treasuries remain one of the few sovereign bonds in the developed world that held positive yields throughout the pandemic. Though the Federal Reserve has committed to keeping short-term rates near zero for the foreseeable future, it should come as a relief to investors that thus far, Fed Chair Jerome Powell has dismissed the idea of negative short-term rates in the U.S.
However, negative yielding debt does affect U.S. investors. Even after accounting for the costs of hedging out currency risks, Japanese investors can obtain 70 bps more in yield by investing in the U.S. 10-year Treasury note compared to a 10-year Japanese government bond, while German investors can earn 0.37% after hedging costs, compared with the -0.45% current yield of the German 10-year bund, which is the highest level in nearly five months. These factors increase demand for U.S. debt, which has helped to depress Treasuries yields and dampen the outlook for fixed income investors.
What does the future of negative yielding debt look like? As shown in the LPL Chart of the Day, the good news is that this amount of negative yielding debt has declined substantially in the past two months and fallen back below the previous record high set in 2019. We believe this amount should continue to fall in 2021 as global economies recover and safe-haven yields rise, contributing to the 10-year Treasury yield moving toward our year-end 2021 forecast of 1.25–1.75%.
For more of our 2021 market insights and forecasts, please read our new LPL Research Outlook 2021: Powering Forward.
IMPORTANT DISCLOSURES
This material is for general information only and is not intended to provide specific advice or recommendations for any individual. There is no assurance that the views or strategies discussed are suitable for all investors or will yield positive outcomes. Investing involves risks including possible loss of principal. Any economic forecasts set forth may not develop as predicted and are subject to change.
References to markets, asset classes, and sectors are generally regarding the corresponding market index. Indexes are unmanaged statistical composites and cannot be invested into directly. Index performance is not indicative of the performance of any investment and do not reflect fees, expenses, or sales charges. All performance referenced is historical and is no guarantee of future results.
Any company names noted herein are for educational purposes only and not an indication of trading intent or a solicitation of their products or services. LPL Financial doesn’t provide research on individual equities. All information is believed to be from reliable sources; however, LPL Financial makes no representation as to its completeness or accuracy.
All index and market data from Bloomberg.
This Research material was prepared by LPL Financial, LLC.
Securities and advisory services offered through LPL Financial (LPL), a registered investment advisor and broker-dealer (member FINRA/SIPC).
Insurance products are offered through LPL or its licensed affiliates. To the extent you are receiving investment advice from a separately registered independent investment advisor that is not an LPL affiliate, please note LPL makes no representation with respect to such entity.
- Not Insured by FDIC/NCUA or Any Other Government Agency
- Not Bank/Credit Union Guaranteed
- Not Bank/Credit Union Deposits or Obligations
- May Lose Value
For Public Use – Tracking 1-05107708