
As stocks rallied 30% off the March 23 lows and earnings expectations were cut dramatically, valuations have become increasingly concerning for many investors (including some high-profile hedge fund managers being quoted in the financial press).
As shown in the LPL Chart of the Day, the forward (next 12 months) price-to-earnings (PE) multiple for the S&P 500 Index recently eclipsed 20, which is overvalued based on historical averages and at the highest level since the tech bubble in the late 1990s.
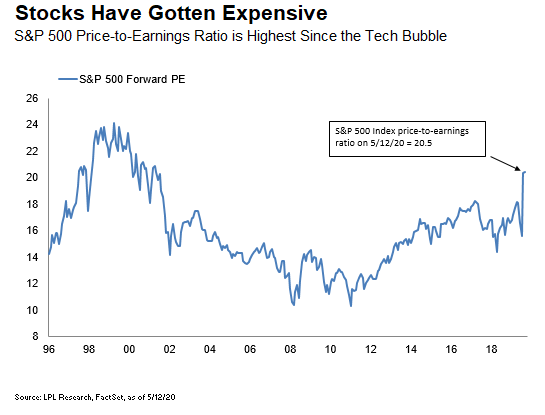
While stocks look expensive on this metric—one of the reasons why we expect a correction of perhaps 10% from the April 29 highs—valuations may be getting too much attention.
“Stocks look overvalued based on earnings estimates for the next year, which will probably fall further,” said LPL Financial Equity Strategist Jeffrey Buchbinder. “While the return to 2019’s earnings levels may still be two years or more off, the potential for steady improvement and low interest rates suggest they may not be as stretched as they appear.”
So how worried should investors be? Here are three reasons not to worry too much:
- Earnings will eventually come back. This recession has an end date, and eventually we’ll beat this virus. So while earnings will take time to reach last year’s levels, they should steadily improve starting next quarter. A vaccine could accelerate the timetable.
- Interest rates and inflation are low. A 20 PE with a sub-1% yield on the 10-year Treasury without a whiff of inflation on the horizon is not unreasonable. And Federal Reserve support isn’t going away anytime soon. In such a low-rate environment, the opportunity cost of waiting an extra year for earnings to come through is not high. Most of a stock’s value is derived from the earnings the company could generate in year two and beyond.
- Valuations are not good short-term timing tools. There is essentially no statistical relationship between PE ratios and subsequent one-year performance for the stock market. Although we expect more volatility as the path of the economy and corporate profits becomes clearer, we also expect stocks to grow into their valuations as earnings likely recover next year.
Stocks are expensive on traditional PE metrics, and a correction would not surprise us. But given the environment we’re in, valuations are not as worrisome as they may appear. The potential for a steady recovery in earnings over the next couple of years with low interest rates suggests that some of the valuation fears may be exaggerated.
IMPORTANT DISCLOSURES
This material is for general information only and is not intended to provide specific advice or recommendations for any individual. There is no assurance that the views or strategies discussed are suitable for all investors or will yield positive outcomes. Investing involves risks including possible loss of principal. Any economic forecasts set forth may not develop as predicted and are subject to change.
References to markets, asset classes, and sectors are generally regarding the corresponding market index. Indexes are unmanaged statistical composites and cannot be invested into directly. Index performance is not indicative of the performance of any investment and do not reflect fees, expenses, or sales charges. All performance referenced is historical and is no guarantee of future results.
Any company names noted herein are for educational purposes only and not an indication of trading intent or a solicitation of their products or services. LPL Financial doesn’t provide research on individual equities. All information is believed to be from reliable sources; however, LPL Financial makes no representation as to its completeness or accuracy.
The Standard & Poor’s 500 Index (S&P500) is a capitalization-weighted index of 500 stocks designed to measure performance of the broad domestic economy through changes in the aggregate market value of 500 stocks representing all major industries.
The PE ratio (price-to-earnings ratio) is a measure of the price paid for a share relative to the annual net income or profit earned by the firm per share. It is a financial ratio used for valuation: a higher PE ratio means that investors are paying more for each unit of net income, so the stock is more expensive compared to one with lower PE ratio.
This Research material was prepared by LPL Financial, LLC.
Securities and advisory services offered through LPL Financial (LPL), a registered investment advisor and broker-dealer (member FINRA/SIPC).
Insurance products are offered through LPL or its licensed affiliates. To the extent you are receiving investment advice from a separately registered independent investment advisor that is not an LPL affiliate, please note LPL makes no representation with respect to such entity.
- Not Insured by FDIC/NCUA or Any Other Government Agency
- Not Bank/Credit Union Guaranteed
- Not Bank/Credit Union Deposits or Obligations
- May Lose Value
For Public Use | Tracking # 1-05010941