

The onset of the global pandemic shocked the economy and triggered one of the deepest recessions ever in 2020. As investors fled to “safe haven” Treasuries and the Federal Reserve (Fed) lowered interest rates, the yield on the 10-year Treasury traded as low as 0.31% intraday on March 9, 2020 (its lowest closing yield was 0.51% on August 8).
Earlier this year, mortgage rates followed the 10-year Treasury yield lower to register an all-time low value of 3.3%. Fueled by additional purchases of mortgage-backed securities (MBS) by the Fed, mortgage spreads have narrowed while Treasury yields remain at depressed levels, only recently trading above 1%. As shown in the LPL Chart of the Day, the average rate on a 30-year fixed rate mortgage has continued to fall, now trading at just 2.88% according to Bankrate.
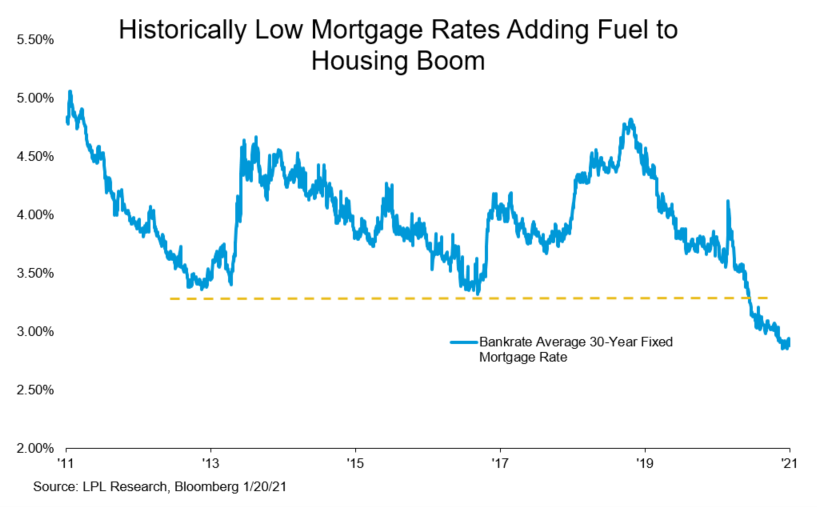
We’ve often referred to the economic recovery taking on a “K shape” where some segments of the economy are recovering and performing well (the upper leg of a K) and other areas are struggling (the lower leg of a K). The housing market has found itself in the upper leg of the recovery, as housing starts, building permits, existing home sales, and home prices have all surpassed their pre-pandemic highs.
“Perhaps it should come as no surprise that the housing market has boomed following a big decline in mortgage rates,” noted LPL Chief Market Strategist Ryan Detrick. “Low rates, undersupply, and the working-from-home environment have given us the best housing market in over a decade.”
Going forward, we continue to favor MBS relative to other investment-grade asset classes. MBS provide a more attractive yield than Treasuries, while also providing better insulation from rising interest rates compared to investment-grade corporate bonds.
IMPORTANT DISCLOSURES
This material is for general information only and is not intended to provide specific advice or recommendations for any individual. There is no assurance that the views or strategies discussed are suitable for all investors or will yield positive outcomes. Investing involves risks including possible loss of principal. Any economic forecasts set forth may not develop as predicted and are subject to change.
References to markets, asset classes, and sectors are generally regarding the corresponding market index. Indexes are unmanaged statistical composites and cannot be invested into directly. Index performance is not indicative of the performance of any investment and do not reflect fees, expenses, or sales charges. All performance referenced is historical and is no guarantee of future results.
Any company names noted herein are for educational purposes only and not an indication of trading intent or a solicitation of their products or services. LPL Financial doesn’t provide research on individual equities. All information is believed to be from reliable sources; however, LPL Financial makes no representation as to its completeness or accuracy.
All index and market data from FactSet and Bloomberg.
This Research material was prepared by LPL Financial, LLC.
Securities and advisory services offered through LPL Financial (LPL), a registered investment advisor and broker-dealer (member FINRA/SIPC).
Insurance products are offered through LPL or its licensed affiliates. To the extent you are receiving investment advice from a separately registered independent investment advisor that is not an LPL affiliate, please note LPL makes no representation with respect to such entity.
- Not Insured by FDIC/NCUA or Any Other Government Agency
- Not Bank/Credit Union Guaranteed
- Not Bank/Credit Union Deposits or Obligations
- May Lose Value
For Public Use – Tracking 1-05102166