

Markets are off to a strong start this year, with the S&P 500 Index up about 14% so far. However, most of those gains came early in the year, and many stocks have stagnated over recent months. While we remain overweight on stocks relative to bonds, this week we explore three things that worry us—and could make the market more susceptible to a pullback as we enter the second half of 2021.
YEAR TWO TENDS TO BE CHOPPY
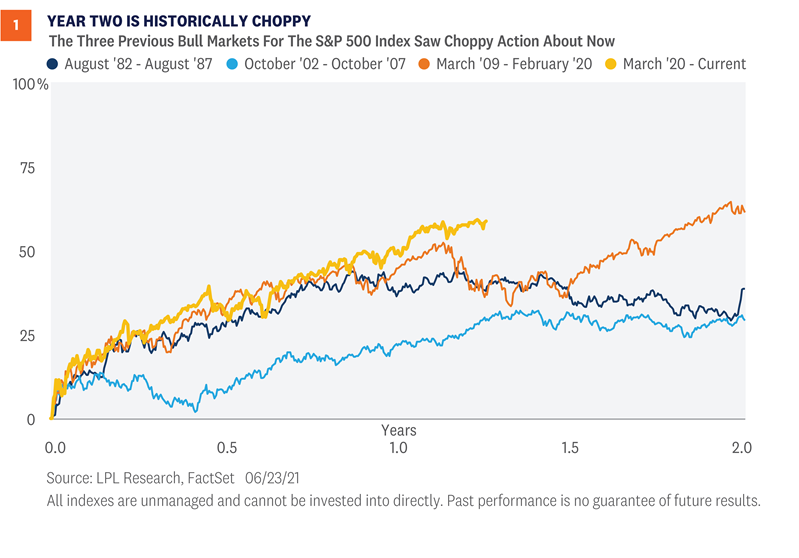
The good news is the second year of every single bull market since World War II has seen the S&P 500 climb higher. That is 12 for 12 for year two gains. The second year for this bull market started on March 23, 2021, and so far, stocks are off to a solid start—up more than 9%. The bad news is for many of the past bull markets, year-two gains were quite muted, as stocks caught their breath from the year-one sprint. With the S&P 500 up more than 90% from the March 23, 2020 lows, we wouldn’t be surprised at all if history repeated and stocks saw choppier action in year two.
In fact, taking a closer look at the most recent bull markets it’s clear that a choppy and frustrating path is perfectly normal in year two [Figure 1].
- Year two of the 1982 bull market saw flat action in much of 1983 and into early 1984, even as the economy improved.
- Year two of the 2003 bull market saw similar choppy action in 2004. There’s an old saying that stocks can correct via time or price. In 2004, stocks simply corrected over time with a choppy sideways move after the big year-one gains.
- The 2009 bull market saw a 16% correction during year two in 2010, but stocks managed to consolidate before eventually moving back to new highs by late 2010.
FEWER STOCKS MAKING NEW HIGHS
The S&P 500 Index hit a new record high last week, but under the surface fewer stocks have been participating. Just 15% of the stocks in the index hit a new one-month high along with the benchmark on June 24, and for the first time since December 1999, a record closing high occurred with less than half of the stocks in the index above their 50-day moving averages. If the last few years have taught us anything, it should be that the largest technology stocks are capable of powering the S&P 500 to new highs. However, a far healthier and more sustainable trend typically sees stronger participation, like earlier in the year when new highs in the S&P 500 were commonly accompanied by 30-40% of the index hitting new highs as well.
To be fair, some of this dynamic is due to rotation under the surface. As interest rates have pulled back recently, value-oriented sectors such as materials, financials and industrials have underperformed and outright declined over the past month. Meanwhile, growth stocks have gained more than 6% in that time, boosted by outperformance from some of the most heavily weighted names in the S&P 500, including Apple, Facebook, Amazon, and Alphabet. And though this rotation can help to mute declines in the broad benchmarks, it may also serve to limit upside potential. As the old saying goes, “play the averages, get average returns.”
ELEVATED STOCK VALUATIONS
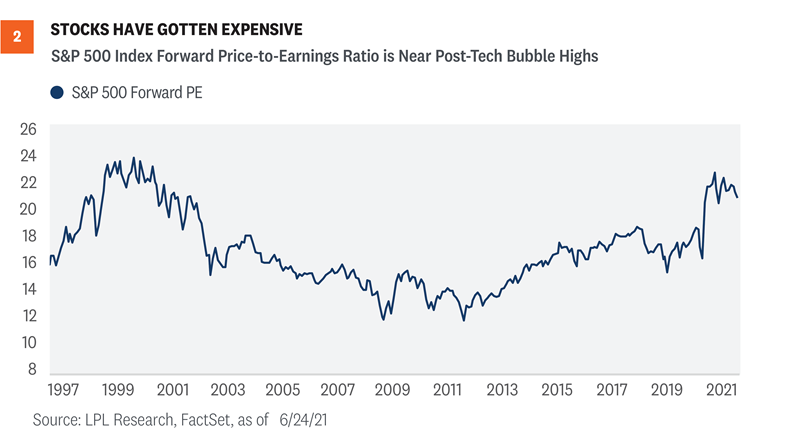
Thanks to the strong start to this bull market, stock valuations have become a widespread concern. Although valuations have not historically been good short-term timing tools for investors, when a downside catalyst eventually emerges, a more richly valued stock market tends to sell off more. After a big rally, more optimism is priced in, and that higher bar then opens the door to disappointment.
But here’s the other side of the story. Many investors assessing valuations look at the price-to-earnings ratio (PE) and stop there. As shown in [Figure 2], the S&P 500’s PE is now about 21, compared with the long-term average near 17. By that measure, stocks do look overvalued, but we don’t think that metric provides a complete picture. Interest rates should be considered, as they tell us how much companies’ future profits are worth in today’s dollars, and they allow us to compare high stock valuations to even higher bond valuations.
To compare stock valuations to bond valuations, we can calculate an equity risk premium, or ERP. This statistic compares the earnings yield on the S&P 500 (the inverse of the P/E) to the 10-year U.S. Treasury yield. Essentially, an ERP compares the earnings generated by stocks to that generated by bonds. As of June 25, based on the consensus 2021 earnings estimate from FactSet, the S&P 500’s ERP is 3.1%. That compared with the long-term average ERP for the index of 0.8% (higher ERPs mean stocks are less expensive relative to bonds).
So, while stock valuations look expensive, which could introduce above-average downside risk, they look quite reasonable when low interest rates are factored in.
CONCLUSION
We remain confident that tactical investors should remain overweight on stocks relative to bonds, but believe it is important to explore risks to that call, especially as the S&P 500 inches closer to our year-end target of 4400-4450. As history shows, year two following a major market low tends to be more volatile, even if the fundamentals seem much sounder than year one. Additional volatility, weaker participation, and high valuations might sound scary, but we believe that any weakness would likely be a buying opportunity, as the economic and earnings environment remain exceptionally strong as we head into the second half of 2021.
Please note, there will be no Weekly Market Commentary next week, in observance of the July 4 holiday.
Read previous editions of Weekly Market Commentaryon lpl.com at News & Media.
Ryan Detrick, CMT, Chief Market Strategist, LPL Financial
Jeff Buchbinder, CFA, Equity Strategist, LPL Financial
Scott Brown, CMT, Senior Analyst, LPL Financial
______________________________________________________________________________________________
IMPORTANT DISCLOSURES
This material is for general information only and is not intended to provide specific advice or recommendations for any individual. There is no assurance that the views or strategies discussed are suitable for all investors or will yield positive outcomes. Investing involves risks including possible loss of principal. Any economic forecasts set forth may not develop as predicted and are subject to change.
References to markets, asset classes, and sectors are generally regarding the corresponding market index. Indexes are unmanaged statistical composites and cannot be invested into directly. Index performance is not indicative of the performance of any investment and do not reflect fees, expenses, or sales charges. All performance referenced is historical and is no guarantee of future results.
Any company names noted herein are for educational purposes only and not an indication of trading intent or a solicitation of their products or services. LPL Financial doesn’t provide research on individual equities.
All information is believed to be from reliable sources; however, LPL Financial makes no representation as to its completeness or accuracy.
US Treasuries may be considered “safe haven” investments but do carry some degree of risk including interest rate, credit, and market risk. Bonds are subject to market and interest rate risk if sold prior to maturity. Bond values will decline as interest rates rise and bonds are subject to availability and change in price.
The Standard & Poor’s 500 Index (S&P500) is a capitalization-weighted index of 500 stocks designed to measure performance of the broad domestic economy through changes in the aggregate market value of 500 stocks representing all major industries.
The PE ratio (price-to-earnings ratio) is a measure of the price paid for a share relative to the annual net income or profit earned by the firm per share. It is a financial ratio used for valuation: a higher PE ratio means that investors are paying more for each unit of net income, so the stock is more expensive compared to one with lower PE ratio.
Earnings per share (EPS) is the portion of a company’s profit allocated to each outstanding share of common stock. EPS serves as an indicator of a company’s profitability. Earnings per share is generally considered to be the single most important variable in determining a share’s price. It is also a major component used to calculate the price-to-earnings valuation ratio.
All index data from FactSet.
This research material has been prepared by LPL Financial LLC.
Securities and advisory services offered through LPL Financial (LPL), a registered investment advisor and broker-dealer (member FINRA/SIPC). Insurance products are offered through LPL or its licensed affiliates. To the extent you are receiving investment advice from a separately registered independent investment advisor that is not an LPL affiliate, please note LPL makes no representation with respect to such entity.
| Not Insured by FDIC/NCUA or Any Other Government Agency | Not Bank/Credit Union Guaranteed | Not Bank/Credit Union Deposits or Obligations | May Lose Value |
RES-800951-0621 | For Public Use | Tracking # 1-05160472 (Exp. 06/22)